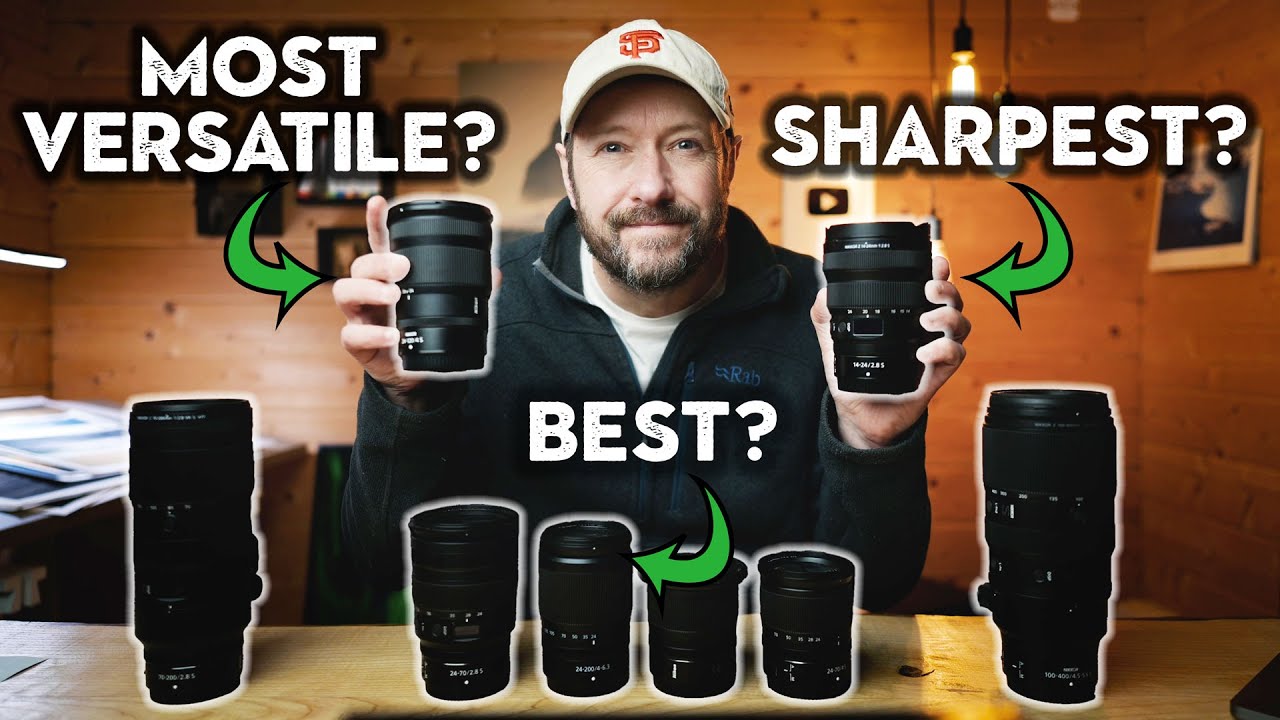
I used to make gear decisions based on vibes. A lens felt sharp in the store, or a YouTuber said it was good, so I bought it. It wasn’t until I started actually tracking which lenses I reached for during real shoots that I realized half my kit was collecting dust. That shift in thinking, from spec-sheet shopping to usage-based evaluation, is exactly what Nigel Danson demonstrates in this lens ranking tutorial. Watch the full tutorial on YouTube
In this Nigel Danson tutorial, he does something most gear reviewers never bother with: he opens Lightroom, filters his entire two-year catalog of picked images, and lets the data tell him which lenses actually earned their spot in the bag. No gut feelings, no brand loyalty, just raw usage numbers cross-referenced with image quality. For someone like me who has spent more hours building lens comparison spreadsheets than I care to admit, watching a working professional do this with real field data was genuinely useful.
The method translates directly to any shooter’s workflow, whether you’re on a $600 mirrorless or a full Nikon Z system. The tools are the same. Lightroom’s metadata filters are free to use. You just need to commit to the process.
Step 1: Open Lightroom and Filter to Your Picked Images
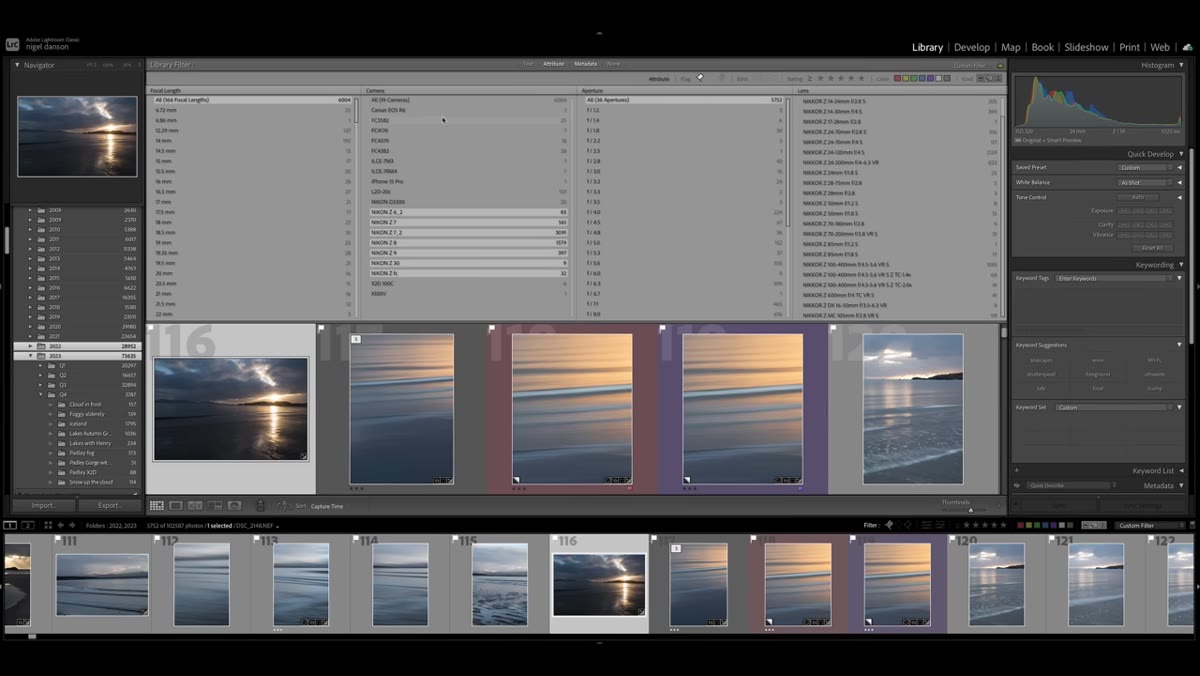 Lightroom catalog open with picked images filtered
Start in Lightroom’s Library module. Use the filter bar to isolate your flagged or picked images only, then set the date range to cover the last one to two years of shooting. This gives you a sample size large enough to be meaningful without pulling in work from a completely different season of your shooting life. Danson had around 5,700 picked photos in his two-year window, which is a solid working dataset.
Lightroom catalog open with picked images filtered
Start in Lightroom’s Library module. Use the filter bar to isolate your flagged or picked images only, then set the date range to cover the last one to two years of shooting. This gives you a sample size large enough to be meaningful without pulling in work from a completely different season of your shooting life. Danson had around 5,700 picked photos in his two-year window, which is a solid working dataset.
The key here is consistency in how you flag images. If you only flag selects after a cull, you’re measuring which lens produced keepers, not just which one you grabbed the most. That distinction matters.
Step 2: Pull Up the Lens Metadata Panel on the Right Side
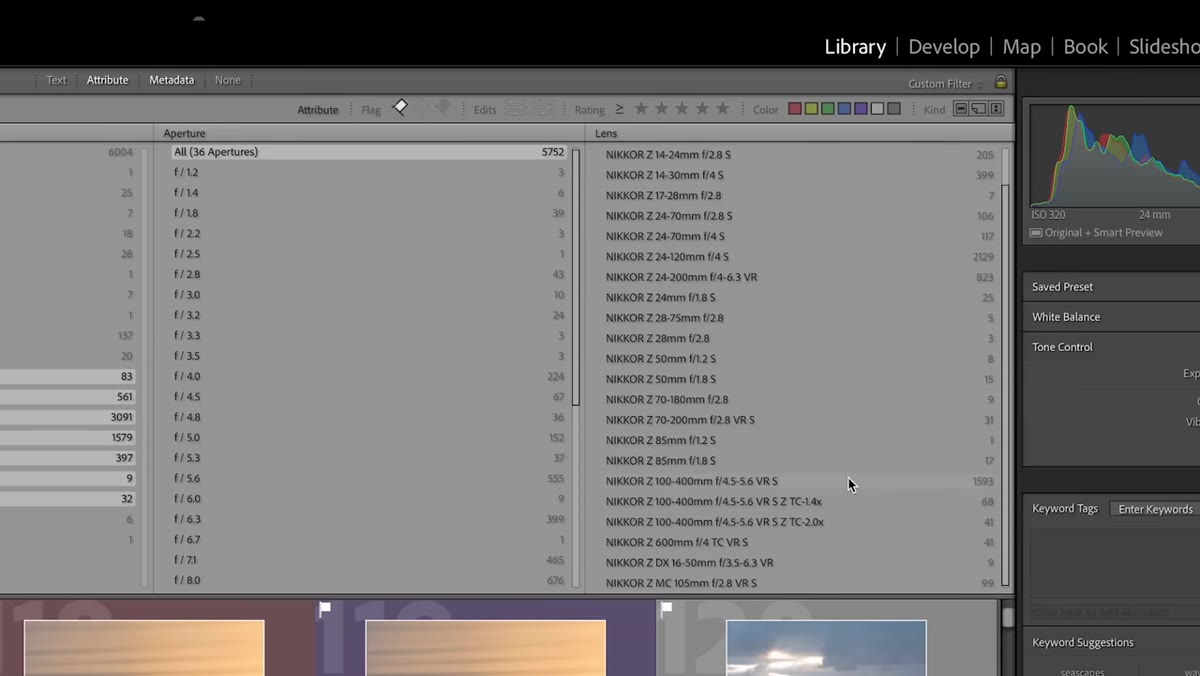 Lens metadata breakdown visible in Lightroom right panel
With your filtered picks visible, look at the metadata panel on the right side of the Library module. Lightroom will show you a breakdown of which lenses appear in your catalog and how many images are attached to each one. This is where the ranking starts to get real fast.
Lens metadata breakdown visible in Lightroom right panel
With your filtered picks visible, look at the metadata panel on the right side of the Library module. Lightroom will show you a breakdown of which lenses appear in your catalog and how many images are attached to each one. This is where the ranking starts to get real fast.
Danson’s results showed the Nikon Z 24-120mm f/4 at the top by a significant margin. Not because it’s the sharpest lens he owns, but because it’s the one that actually got used across the widest range of conditions. That’s a different kind of winning.
Step 3: Narrow the Filter to Three-Star Images or Higher
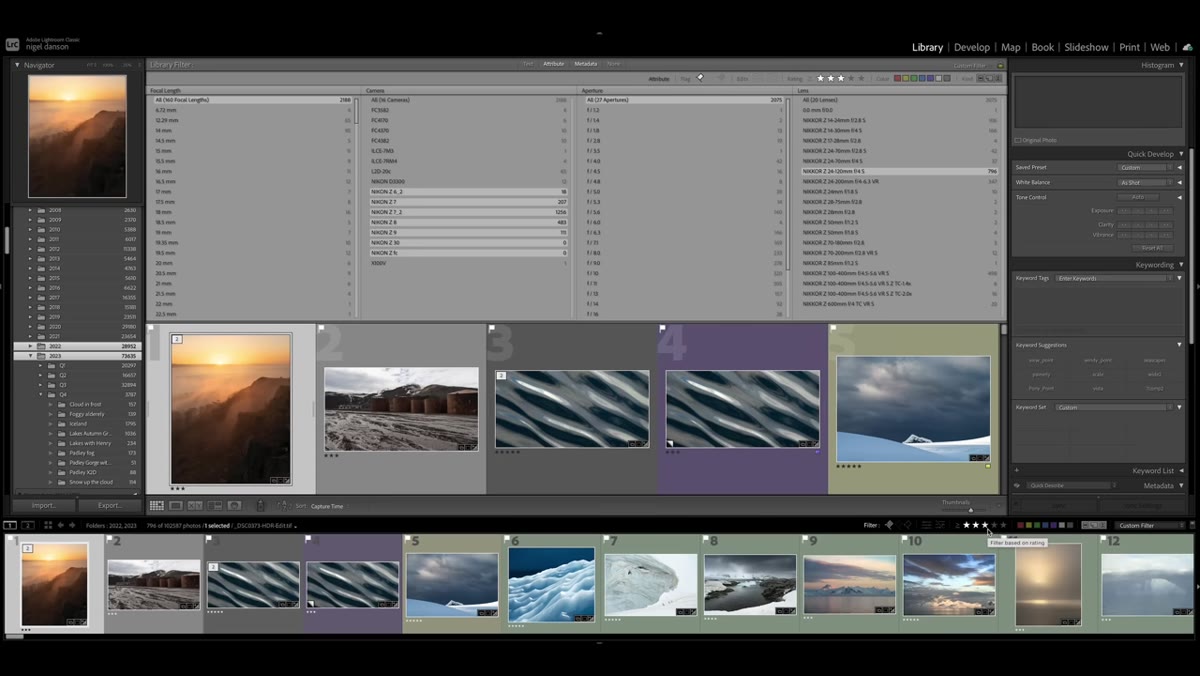 Three-star filter applied showing 24-120 still dominates
Once you have the basic lens breakdown, tighten the filter to only show images you’ve rated three stars or above. This removes the test shots and the “maybe” frames, leaving only the images you genuinely considered worth editing. Danson found that even at this higher quality threshold, the 24-120 still dominated his results by nearly double the next closest lens.
Three-star filter applied showing 24-120 still dominates
Once you have the basic lens breakdown, tighten the filter to only show images you’ve rated three stars or above. This removes the test shots and the “maybe” frames, leaving only the images you genuinely considered worth editing. Danson found that even at this higher quality threshold, the 24-120 still dominated his results by nearly double the next closest lens.
This step is important because raw shot count can be misleading. A lens you used on one hectic trip might rack up numbers without actually being a consistent performer. Quality-filtered data tells a cleaner story.
Step 4: Identify Your Sharpest Lens Separately From Your Most-Used Lens
 24-70mm f2.8 identified as sharpest lens in the collection
Most-used and sharpest are not the same category, and Danson is smart to split them. After pulling his usage data, he separately evaluated which lens he considered optically sharpest. For him, that was the 24-70mm f/2.8, his former go-to for woodland photography. It’s the kind of lens that punches at the top of the sharpness charts but didn’t show up as his most-used because the 24-120 offers a more practical range for how he actually shoots landscapes.
24-70mm f2.8 identified as sharpest lens in the collection
Most-used and sharpest are not the same category, and Danson is smart to split them. After pulling his usage data, he separately evaluated which lens he considered optically sharpest. For him, that was the 24-70mm f/2.8, his former go-to for woodland photography. It’s the kind of lens that punches at the top of the sharpness charts but didn’t show up as his most-used because the 24-120 offers a more practical range for how he actually shoots landscapes.
For budget shooters, this is a genuinely useful distinction. You might own a prime that’s razor sharp but find yourself always reaching for a variable aperture zoom because it handles more situations. Neither lens is wrong. You’re just doing different jobs.
Step 5: Evaluate Specialty Lenses Against the Tradeoffs You’re Actually Making
 100-400mm stats shown with Antarctica usage context
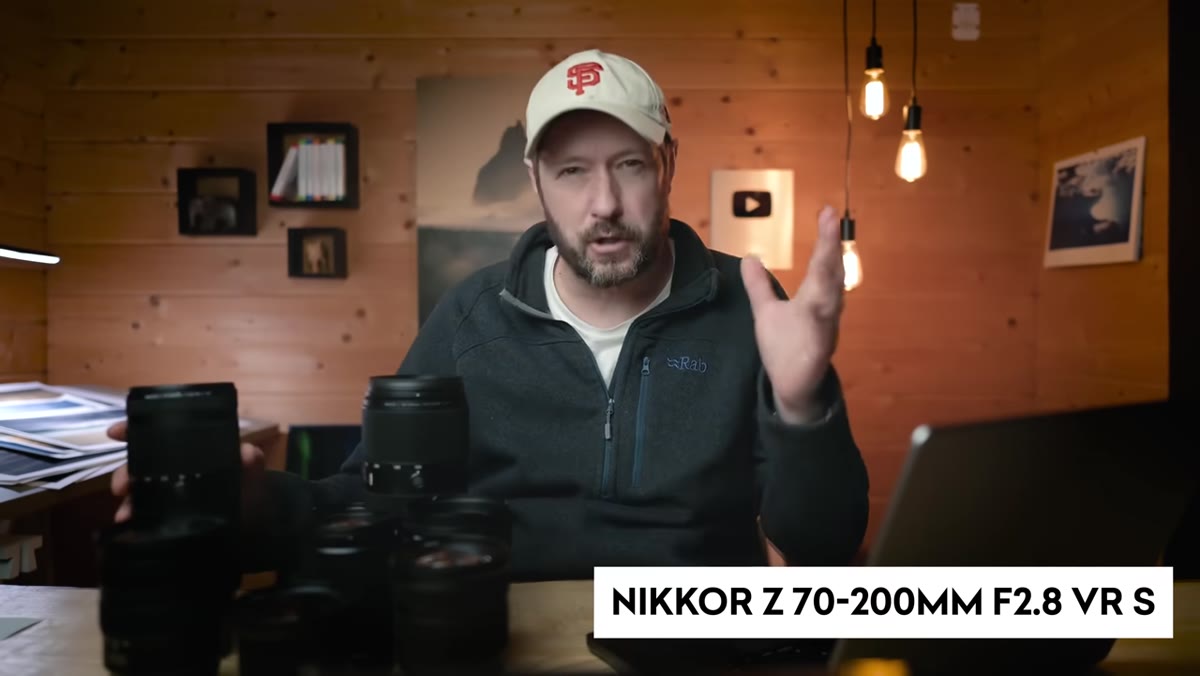
Danson’s 70-200mm showed only 12 three-star images over two years despite being one of his sharpest lenses. His reason for this is practical: the 100-400mm is about the same weight and gives him more reach. Since he already carries the 24-120 for the mid-range focal lengths, he loses nothing by skipping the 70-100mm range that the 70-200 covers. The 100-400 earns its weight through bird photography, wave compression shots, and picking out iceberg details from a distance.
100-400mm stats shown with Antarctica usage context
Danson’s 70-200mm showed only 12 three-star images over two years despite being one of his sharpest lenses. His reason for this is practical: the 100-400mm is about the same weight and gives him more reach. Since he already carries the 24-120 for the mid-range focal lengths, he loses nothing by skipping the 70-100mm range that the 70-200 covers. The 100-400 earns its weight through bird photography, wave compression shots, and picking out iceberg details from a distance.
The principle here applies even if your “specialty lens” is a $150 budget telephoto. Ask yourself what you’re actually sacrificing by carrying it versus something with more range. If the answer is nothing meaningful, you already have your answer.
Step 6: Let the Data Challenge Your Assumptions About What You Need
 All lenses visible in Lightroom with usage numbers side by side
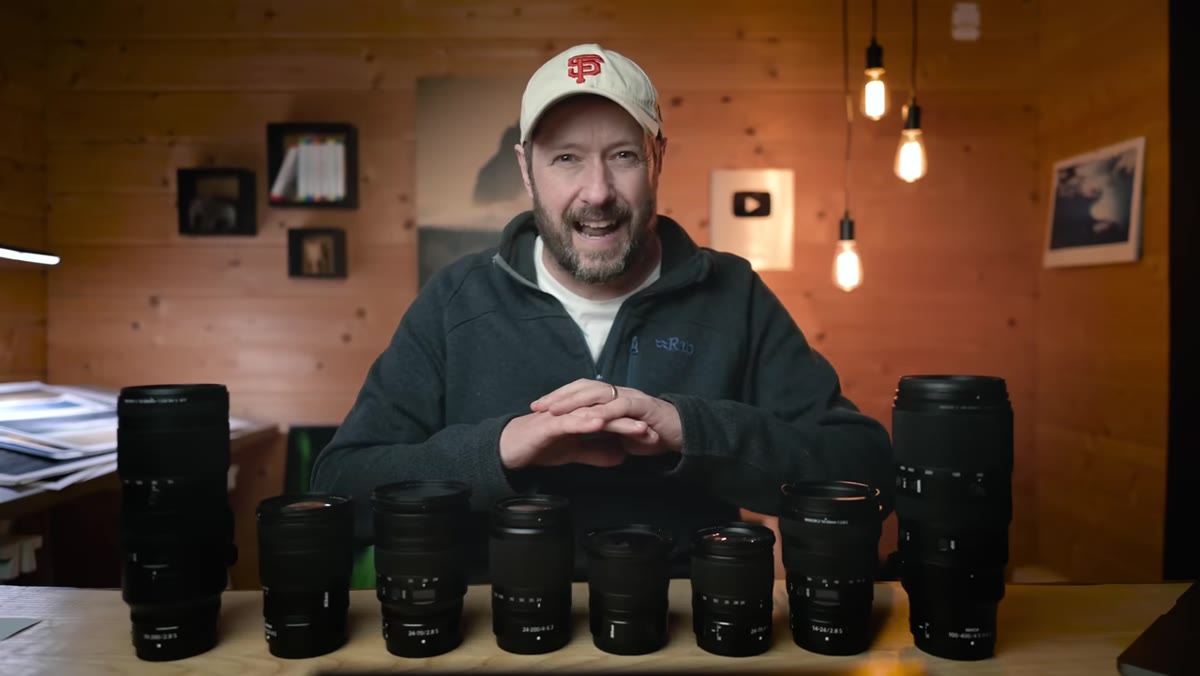
The final step isn’t really a click in Lightroom. It’s a mental one. Once you see the numbers laid out, be willing to let them change your kit decisions. Danson’s data consistently pointed back to versatile zoom lenses as his real workhorses, even though he had access to sharper primes and more specialized glass.
All lenses visible in Lightroom with usage numbers side by side
The final step isn’t really a click in Lightroom. It’s a mental one. Once you see the numbers laid out, be willing to let them change your kit decisions. Danson’s data consistently pointed back to versatile zoom lenses as his real workhorses, even though he had access to sharper primes and more specialized glass.
For someone making decisions about what to buy next, this kind of usage audit is worth doing before you spend anything. Run the numbers on what you already own. You might find out your “everyday” lens is already doing 80 percent of the work, and the next purchase should plug a specific gap rather than replace something that’s already performing.
What Budget Shooters Should Take From This (With One Caveat)
Danson is shooting with a Nikon Z system and has access to top-tier glass through an ambassador relationship. His sharpest lens is someone else’s entire lens budget. But here’s the thing: the method he’s using doesn’t care what gear you own. I’ve run this same Lightroom audit on kit lenses and third-party budget zooms, and the output is just as revealing.
What I’d add for anyone working with more affordable glass: the usage data becomes even more important when every purchase is a real financial decision. If your $200 lens shows up in 90 percent of your best images, that tells you something about where your money is already working. And if an expensive lens you stretched for is sitting at the bottom of the list, the data will show you that too, no matter how much you want to justify the purchase.
The single biggest takeaway from Danson’s approach: stop ranking your lenses by spec and start ranking them by what your own catalog tells you. Lightroom already has all the data. You just have to look at it.
Watch the full tutorial on YouTube to see Danson walk through his full lens collection, including which ones he’d cut from his bag if he had to travel light.
Comments (1)
Love how you break down complex stuff into manageable steps.
Leave a Comment